(Post initially published on 30/10/2012. Since the program is now finished we updated in May 2015 the last table with the impact on economic growth and its analysis. The rest of the text and our conclusion remain the same.)
A pyrrhic war is a war won at too high a cost. As Pyrrhus said, in 280 BC: "If we are victorious in one more battle with the Romans, we shall be utterly ruined". Recently, Ireland, Spain and Portugal achieved sharp reductions in their current account deficits as depicted in the table below.
Let us examine if these results are similar to a pyrrhic victory.
Indeed, the costs in terms of lost production and related increase in unemployment shown in the table below were so high for Greece and Portugal that one must ask whether for these countries the victors have weakened their economies to a point where they were trapped into a permanent state of lower income and productivity.

There are five basic reasons to fear that it might be the case. First, the adjustment was achieved almost exclusively through output and capacity reduction. Second, the massive conversion of private debt into public debt increased the cost of leverage for all and for a long time which crowded out the most dynamic sector of the economy – the SMEs. Third, the recurrent need for never ending tax increases created a persistent trend for appreciation in their foreign terms of trade, when they needed the opposite. Fourth, it created a permanent stimulus for capital flight. And, finally the resulting increase in long term unemployment raised the level of structural unemployment to unbearable levels.
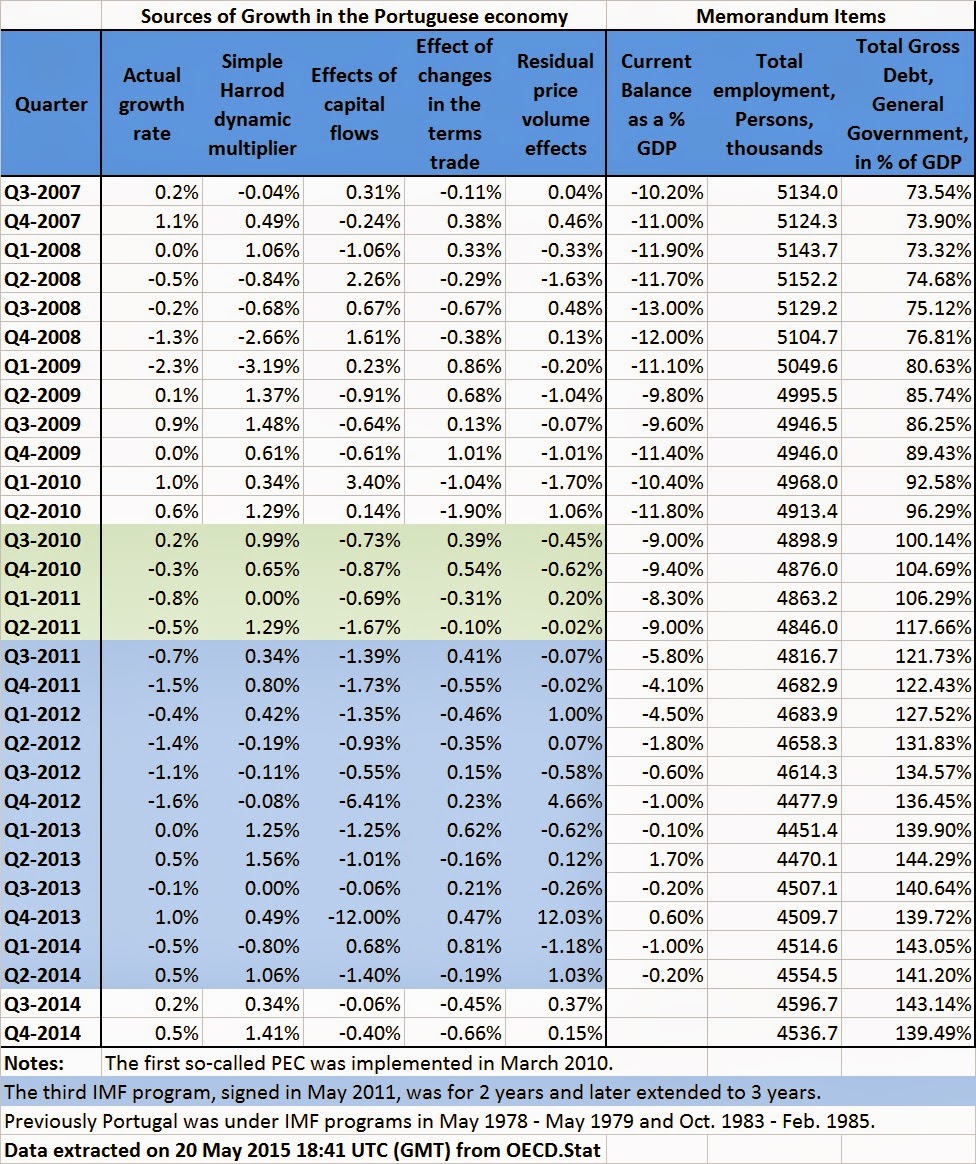
The case of Portugal is especially illustrative because it has duly taken its medicine and achieved the sharpest external correction. We will examine causes one and three above by comparing the current adjustment to that of previous IMF programs in the 1970s and 1980s. The exercise can be done using the financial accounts or through Thirlwall´s balance payments constrained growth accounting framework. I use the later approach to compare the current situation with a similar study I did 20 years ago and which is summarized in the following table with a breakdown of the sources of GDP growth.

The success of the two previous programs can be judged by the reduction in the current account deficit over the first two years and the corresponding cost in terms of output decline. In the first program a reduction of 7.7 percentage points in the current account deficit triggered a slowdown in economic growth only in the first year. The second program achieved a deficit reduction of 10.1 percentage points at a cost of a two-year recession that reduced GDP by 2.1%.
In both programs we measured the role played by the foreign trade multiplier to offset the decline in growth caused by the reduction in capital inflows. In the first program a fall in output due to capital flows of 11.2% was more than offset by a multiplier effect of 19.2%. In the second program a loss of 21.2% caused by a reversal of capital inflows was offset only partially by a 14.5% multiplier effect, but overall in the third year the economy had recovered from the output losses incurred during the 1983-84 recession.
Let us now compare this performance with the current adjustment program for Portugal, as shown in the table below with quarterly values.

During the first year, the pre-Troika PEC adjustment program achieved a reduction in the current account deficit of only 2.8% at a cost of 1.4% in output. The capital effect was responsible for a decline of 3.9% in growth, but was almost offset by a trade multiplier effect of 3.0%.
For the duration of the 3-year IMF adjustment program, the current account deficit was reduced by 8.8 percentage points at a cost of 8.1% in output caused by the program’s effect on capital flows and residual price-volume effects. However, its foreign trade multiplier offset was just 4.8%, which explains why the economic recession has deepened to 5.2% (including the negative impact of terms of a terms of trade improvement brought about an appreciating Euro).
At the end of the program’s three-year period, the adjustment achieved in the current account was similar to that of the previous programs (8.8% against 7.7% and 10.1% in 1978 and 1983, respectively). Yet, this time it took twice as long and the cost in terms of output more than doubled (a 5.2% fall now, against a slowdown of 2.7% in 1978 and a loss of 2.1% in 1983).
In summary:
1) The program achieved its objectives (the current account adjustment and a return to private debt markets); but:
2) It required twice the duration and the output losses of past programs;
3) The banking sector restructuring and fiscal consolidation were negligible. Public debt increased 23.5 percentage points to reach 141.2% of GDP at the end of the program;
4) The social burden was significant, with the unemployment rate rising two percentage points to 14.4%; and
5) There was a minor (0.8%) improvement in productivity because the decline in output was close to the loss of jobs (6%).
For these reasons the Portuguese adjustment must be classified as a pyrrhic victory, which, if repeated, will ruin the country.